- شرکت اندیشه تراشه ویرا
- دفتر تهران: 02176490358-09120613870
- دفتر مشهد: 05138554285-09155177027
- info@Tarashe.Net


اصلاح تصویر و حذف نویز در متلب 3(21)
10 مهر 1402اصلاح تصویر و حذف نویز در متلب (19)
13 آبان 1402
اصلاح تصویر و حذف نویز در متلب 2
توابع Wiener Filtering – gaussian در متلب
بخش 20 آموزش برنامه نویسی درنرم افزار متلب
در این بخش میخوانیم :
1- پیاده سازی فیلترها روی تصاویر
2- روش های متفاوت نویز گیری
3- تابع نویز gaussian
4- روش های حذف نویز با فیلترهای مکان
5- تابع Wiener Filtering
اصلاح تصویر و حذف نویز و کار با توابع Wiener Filtering – gaussian در نرم افزار متلب
با پیاده سازی فیلترها روی تصاویر کد نویسی را آغاز میکنیم :
-
Clc ;
Clear ;
Close all ;
f = imread ( ‘Coins . png ‘ ) ;
f = im2double ( f ) ;
g = imnoise ( f , ‘ salt   &    pepper ‘ ) ;
figure ;
subplot (1, 2, 1 ) ;
imshow ( f ) ;
title ( ‘ Original Image ‘ ) ;
subplot (1 , 2 ,2 ) ;
imshow ( g ) ;
title ( ‘ Noisy Image ‘ ) ;
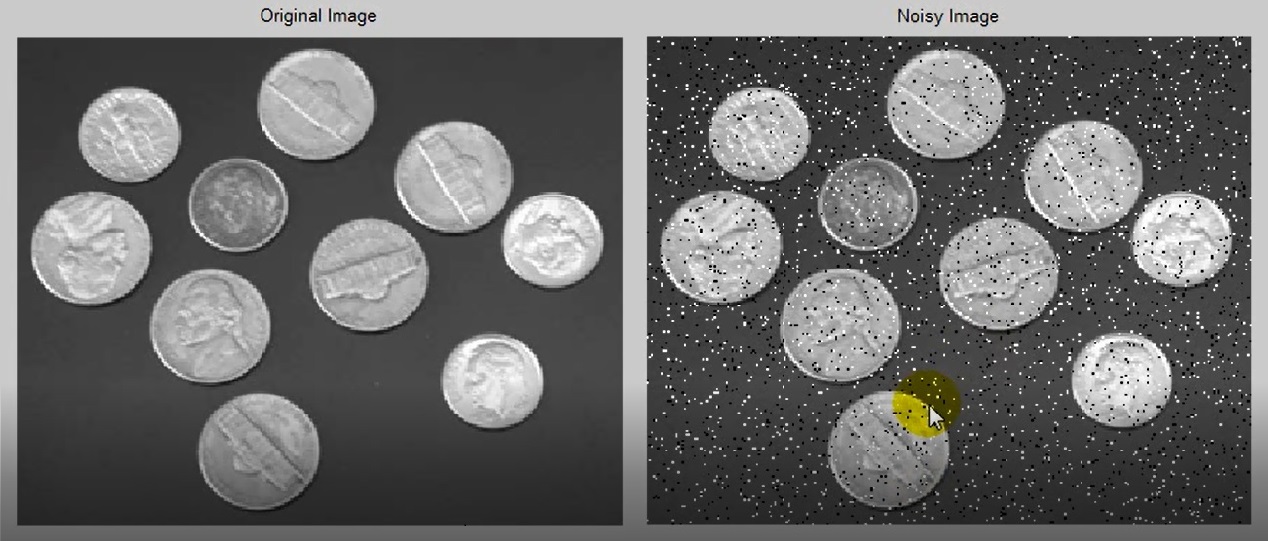
نویز گیری را انجام میدهیم تا بفهمیم با اجرای کدام نویز به تصویر بهتر میرسیم .
-
Clc ;
Clear ;
Close all ;
f = imread ( ‘Coins . png ‘ ) ;
f = im2double ( f ) ;
g = imnoise ( f , ‘ salt   &    pepper ‘ ) ;
fhat1= spatialFilter ( g , ‘median‘ , [5   5] ) ;
fhat2= spatialFilter ( g , ‘ average ‘ , [5   5] ) ;
fhat3= spatialFilter ( g , ‘geomtric‘ , [5   5] ) ;
fhat4= spatialFilter ( g , ‘harmonic‘ , [5   5] ) ;
figure ;
subplot (2, 3, 1 ) ;
imshow ( f ) ;
title ( ‘ Original Image ‘ ) ;
subplot (2, 3, 2) ;
imshow (g) ;
title ( ‘ Noisy Image ‘ ) ;
subplot (2, 3, 3) ;
imshow ( fhat 1 ) ;
title ( ‘ After Meadin Filter ‘ ) ;
subplot (2, 3, 4) ;
imshow (fhat 2 ) ;
title ( ‘ After Average Filter ‘ ) ;
subplot (2, 3, 5) ;
imshow (fhat 3 ) ;
title ( ‘ After Geometric Mean Filter ‘ ) ;
subplot (2, 3, 6 ) ;
imshow (fhat 4 ) ;
title ( ‘After Harmonic Mean Filter ‘ ) ;
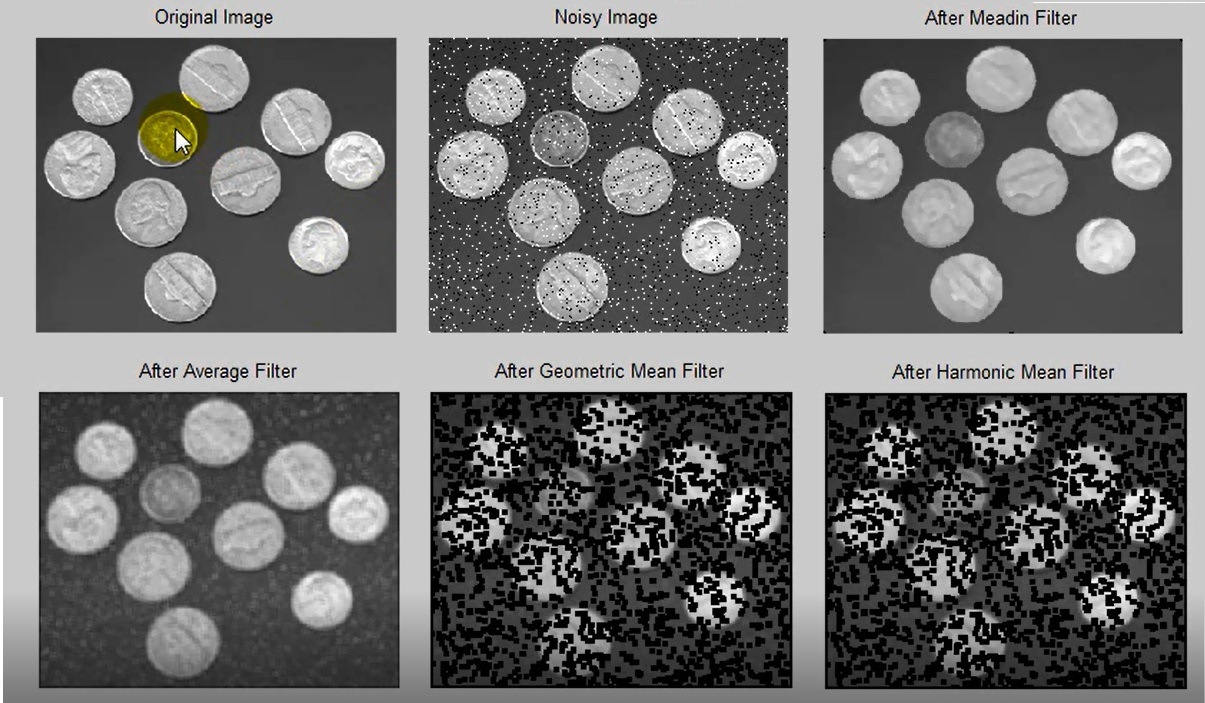
تابع After Meadin Filter نزدیکترین حالت به تصویر اولیه است .
-
function       gm= GeomtricMean (X)
            epsilon = 0.001 ;
         % x = max (x , epsilon ) ;
          x = ( 1- epsilon ) * x + epsilon ;
         gm= exp (mean (Log ( X ) ) ) ;
end
  function       hm = HarmonicMean (X)
            epsilon = 0.001 ;
         % x = max (x , epsilon ) ;
          x = ( 1- epsilon ) * x + epsilon ;
          hm= 1./mean (1./X) ;
end
Clc ;
Clear ;
Close all ;
f = imread ( ‘Coins . png ‘ ) ;
f = im2double ( f ) ;
%g = imnoise ( f , ‘ Gaussian ‘ , 0 , 0.01 ) ;
g = imnoise ( f , ‘ salt   &    pepper ‘ ) ;
fhat1= spatialFilter ( g , ‘median‘ , [5   5] ) ;
fhat2= spatialFilter ( g , ‘ average ‘ , [5   5] ) ;
fhat3= spatialFilter ( g , ‘geomtric‘ , [5   5] ) ;
fhat4= spatialFilter ( g , ‘harmonic‘ , [5   5] ) ;
fhat5= spatialFilter ( g , ‘ charmonic ‘ , [5   5] , 2 ) ;
fhat6= spatialFilter ( g , ‘max ‘ , [5   5] ) ;
fhat7= spatialFilter ( g , ‘min ‘ , [5   5] ) ;
fhat8= spatialFilter ( g , ‘ midpoint ‘ , [5   5] ) ;
fhat9= spatialFilter ( g , ‘ alphatrim ‘ , [5   5] , 0.1 ) ;
figure ;
subplot (3, 4, 1 ) ;
imshow ( f ) ;
title ( ‘ Original Image ‘ ) ;
subplot (3, 4, 2) ;
imshow (g) ;
title ( ‘ Noisy Image ‘ ) ;
subplot (3, 4, 3) ;
imshow ( fhat 1 ) ;
title ( ‘Meadin Filter ‘ ) ;
subplot (3, 4, 4) ;
imshow (fhat 2 ) ;
title ( ‘Average Filter ‘ ) ;
subplot (3, 4, 5) ;
imshow (fhat 3 ) ;
title ( ‘Geometric Mean Filter ‘ ) ;
subplot (3, 4, 6 ) ;
imshow (fhat 4 ) ;
title ( ‘Harmonic Mean Filter ‘ ) ;
subplot (3, 4, 7 ) ;
imshow (fhat 5 ) ;
title ( ‘Contra - Harmonic Filter ‘ ) ;
subplot (3, 4, 8 ) ;
imshow (fhat 6 ) ;
title ( ‘Max Filter ‘ ) ;
subplot (3, 4, 9 ) ;
imshow (fhat 7 ) ;
title ( ‘ Min Filter ‘ ) ;
subplot (3, 4, 10 ) ;
imshow (fhat 8 ) ;
title ( ‘ Mid – point Filter ‘ ) ;
subplot (3, 4, 11 ) ;
imshow (fhat 9 ) ;
title ( ‘ \alpha – trim Filter ‘ ) ;
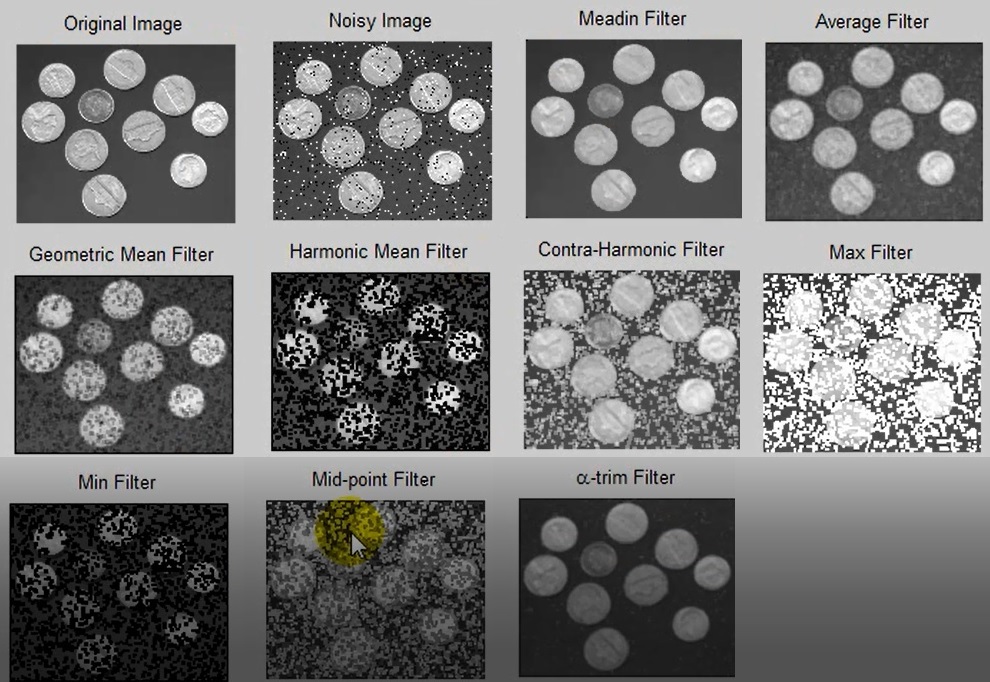
Min Filter به رنگ سیاه متمایل است ، Max Filter به رنگ سفید متمایل است .
نتیجه نویز gaussian را بررسی کنیم :
-
g = imnoise ( f , ‘gaussian ‘ , 0 , 0.01 ) ;
%g = imnoise ( f , ‘ salt   &    pepper ‘ ) ;
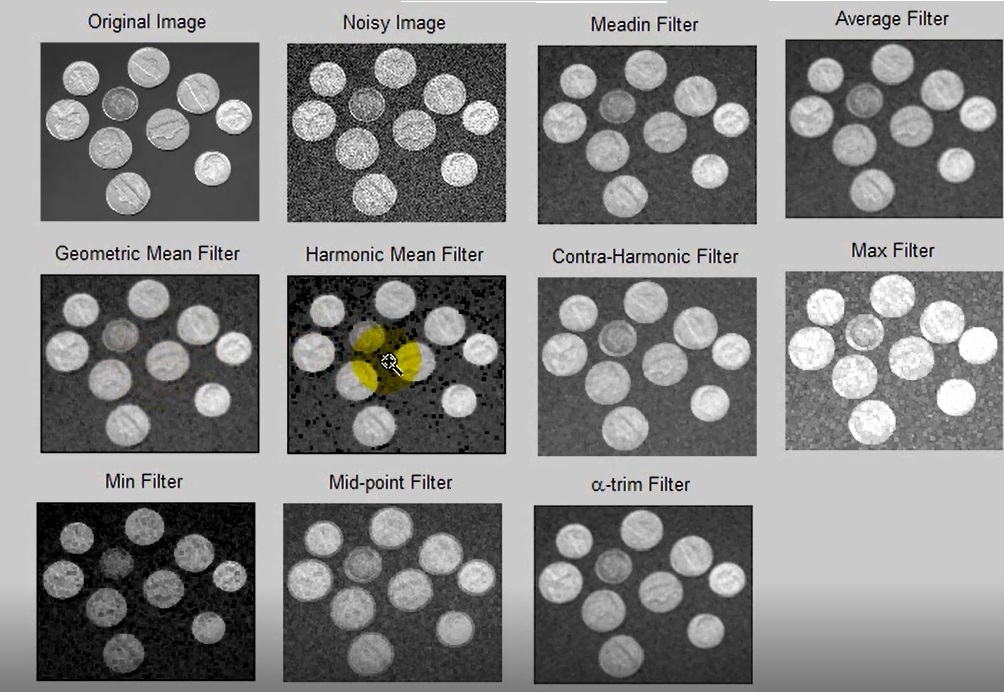
توابع AverageFilter , MeadinFilter , contra-HarmonicFilter,α-trimFilter مشابه هم عمل کردند و تصویری تقریبا یکسان ارائه دادند ، این یک قانون نیست شاید در تصاویر دیگری به نتایج متفاوتی برسیم .
روش های حذف نویز با فیلترهای مکان :
اگر نویزی را به خانواده ای از تصاویر اضافه کنیم میتوانیم خطای رخ داده را با تغییر دادن مقدار معلوم ومشخص بهبود دهیم ویا با ایجاد یک سیستم عصبی یا فازی میتوانیم فیلترهای نامعلوم و غیر خطی را با کمترین خطا بهبود دهیم در اینجا نمونه ئ خروجی تصویر اصلی محسوب میشود ونمونه ورودی تصویر نویزی است .
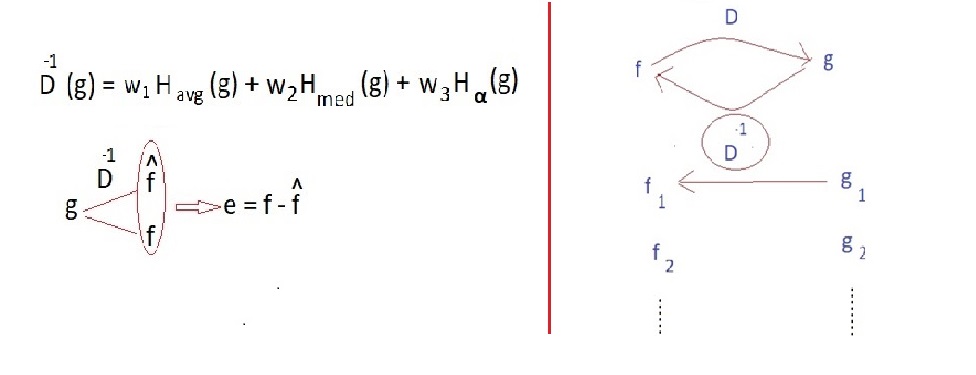
ابتدا باید نشانه های پایه فیلترینگ را بشناسیم و سپس به ترکیب کردن آنها بپردازیم .
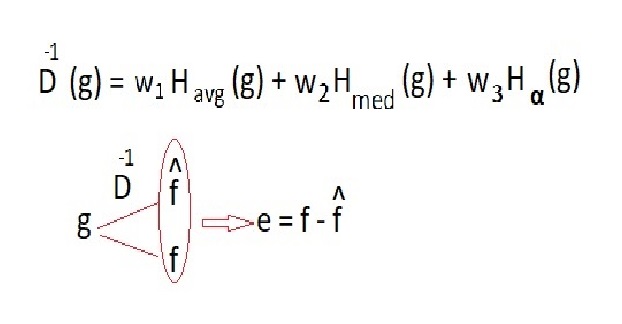
MSE که همان میانگین مربعات خطا ست را به عنوان پایه عملکرد قرار میدهیم از این روش برای خانواده ای از تصاویر استفاده میکنیم و پارامترها را با توجه به MSE در ساختار شبکه عصبی تغییر میدهیم .
از شبکه های عصبی در سیستمهای پلاک خوان پارکینگ در نرم افزار اتوماسیون پارکینگ و نیز نرم افزار پارکینگ استفاده میشود. نرم افزار کنترل تردد خودرو بخشی از نرم افزار پارکینگ تلقی میگردد.
اجرای این روش آسان است اما نتیجه خوبی به ما نمیدهد حتی نویزها را به درستی حذف نمیکند .
در مورد بازسازی تصویر و دی بلورینگ روش های قوی تری در حوزه فرکانس هستند که آنها را بررسی میکنیم .
تغییرات فرکانس های مختلف به روی تصویر به تصویر ورودی هم وابسته است .
Wiener Filtering یکی از راهکارها برای کم کردن خطای تصویر است .
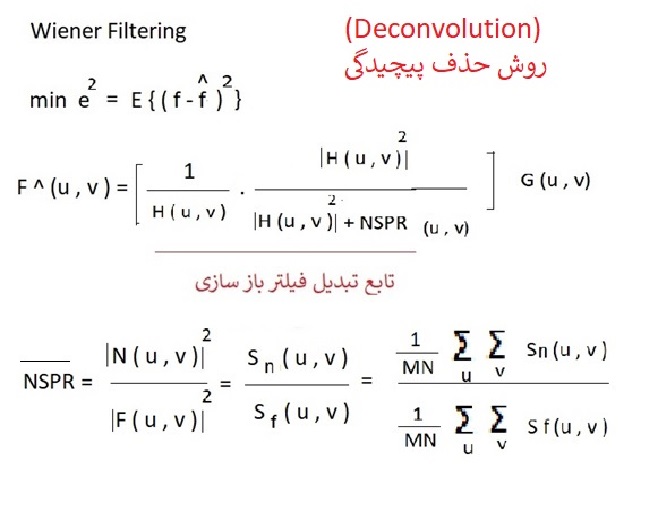
با تابع Wiener Filtering خطا را به کم ترین حالت ممکن می رسانیم .
امید ریاضی تابع هدف را E میگوییم در حوزه فرکانس به حل آن میپردازیم چون در حوزه مکان به راحتی حل نمیشود .
اگر شدت نویز را در کل حساب کنیم چقدر توانایی جا به جا کردن تصویر را دارد ؟
NSPR تابعی از فرکانس است که در آن پارامتر F را نداریم و برای آن که نسبت توان نویز به سیگنال را به دست آوریم فرمول را به پارامترهایی که داریم تبدیل میکنیم که شدت نسبی رابه دست میاورد .